This is our 2018 report. To view the current report please click here.
We are pleased to release our 2018 report on that age old question – How much to tradies really earn?
This is our fifth annual report, and we believe it is the best representation of how much Aussie tradies are really earning.
Why do we believe it’s the best? Because unlike other reports that get all the media attention, we’re not looking at hourly charge out rates or similar. We are using the taxable incomes provided to us by thousands of self-employed tradies from around Australia.
We all know that hourly rates have little meaning when it comes to your taxable income. Just because you charge $150 an hour doesn’t mean you can multiply that by 38 hours and get your weekly earnings!
Every year we get loads of feedback about this report. Some people say the figures wrong are way too low, whilst some say they’re way too high. But hey, that’s what an average is right!
The Highest Earning Tradies
Whilst our figures cover a very wide number of trades and occupations, we only detail the top 10 trades that we have sufficient numbers for, in order to remain statistically accurate.
So without further ado, here are the top 10 earning trades for the 12 months to October 2018:
The top three have stayed the same this year, with boilermakers topping the list at $116,200, followed by electricians and plumbers.
For the first time in recent years we had an occupation drop from the list. Handymen are no longer in the top ten, and have been replaced be landscapers.
Before you go saying “I know plenty of boilermakers/sparkies/whatever trade who earn more than $100k”. Yes we know they do, and plenty on our lists do too, but this is an average figure.
| Rank | Change | Trade | Income | Change |
| 1 | – | Boilermakers | $116,200 | +16% |
| 2 | – | Electricians | $91,788 | +3% |
| 3 | – | Plumbers | $86,372 | -1% |
| 4 | +2 | Plasterers | $83,540 | +10% |
| 5 | +2 | Bricklayers | $83,404 | +21% |
| 6 | – | Landscapers | $80,144 | – |
| 7 | -3 | Cabinetmakers | $79,308 | -1% |
| 8 | -3 | Carpenters | $77,361 | -3% |
| 9 | +1 | Painters | $75,155 | +12% |
| 10 | -3 | Tilers | $74,333 | +9% |
The biggest movers this year were bricklayers, increasing over 20% to $83,404. They did suffer a big drop in the previous year however, going down by 16%. It’s highly unusual for a trade to bounce around that much across the years, so we may have just had a lot of lower earning brickies in 2017.
Only three trades had a drop in their average incomes this year, with plumbers dropping 0.9%, cabinet makers down 1.0% and carpenters reducing by 2.9%. It must be said these are very minor decreases, and probably don’t mean much in the grand scheme.
As always there were a small number of trades and occupations that could have featured in the top ten, however the number of entries were considered too low to be statistically accurate.
These included refrigeration mechanics, air conditioning contractors, concreters, earthmovers, riggers, scaffolders and stonemasons.
If you’re in one of these trades and want to see yours in the top ten, use Trade Risk for your income protection to help us gather more figures! You’ll be rewarded with award-winning service and advice.
Comparison to the National Average
Our figures show that the average taxable income for a tradie in 2018 is $81,636. That’s a slight drop from the $82,766 average we saw last year.
The national average income in Australia, according to the ABS, is $85,800.
That makes our figures for tradies quite close to the national average across all occupations and business types, but the gap has grown a little since last year.
The closeness still gives us a lot of confidence that our figures are very representative of the true earnings of Aussie tradies.
It’s important to remember that our figures include tradies who are predominantly sole traders and subcontractors, whereas the national average from the ABS will include all sorts of outrageously paid CEOs and executives.
For that reason, just because the tradie average is slightly below the national average, it does not mean that a typical tradie earns less than a typical non-tradie.
Tradie Earnings by State
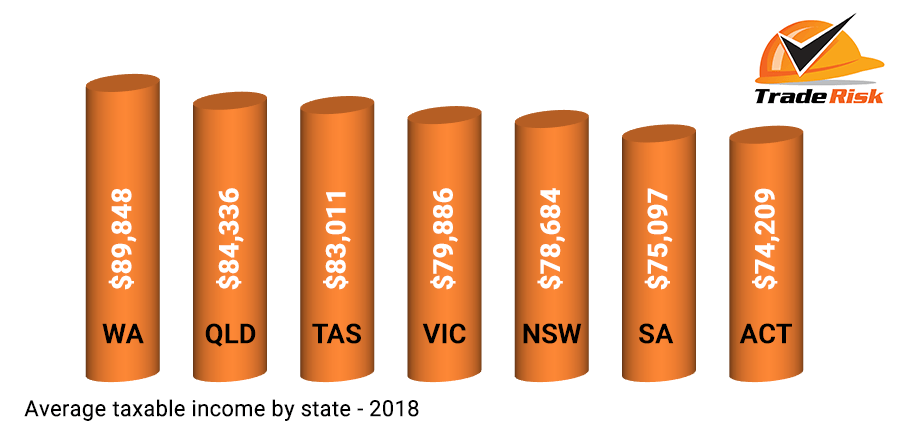
This year for the first time we’ve looked at the averages by state.
We have data for every state and territory, however the NT had too few entries to give a statistically reliable figure. For the record though, it would have been number one based on the figures we had.
Tasmania had only just enough entries to be considered reliable, but given the low number, our figure for Tasmania might not be as reliable as some of the other states which had hundreds of entries each.
| Rank | Change | State | Income | Change |
| 1 | +3 | WA | $89,848 | +14% |
| 2 | -1 | QLD | $84,336 | -1% |
| 3 | +2 | TAS | $83,011 | +13% |
| 4 | -1 | VIC | $79,886 | -1% |
| 5 | -3 | NSW | $78,684 | -7% |
| 6 | – | SA | $75,097 | +6% |
| 7 | – | ACT | $74,209 | +5% |
| – | – | NT | – | – |
Looking at the top two states, WA and QLD, it would be easy to think these have topped the list due to their exposure to the mining sector. That could be true, however we don’t actually insure a huge number of tradies in the resources industry (certainly some, but not a huge number) so we don’t believe that’s what’s driving it.
Overall income bands
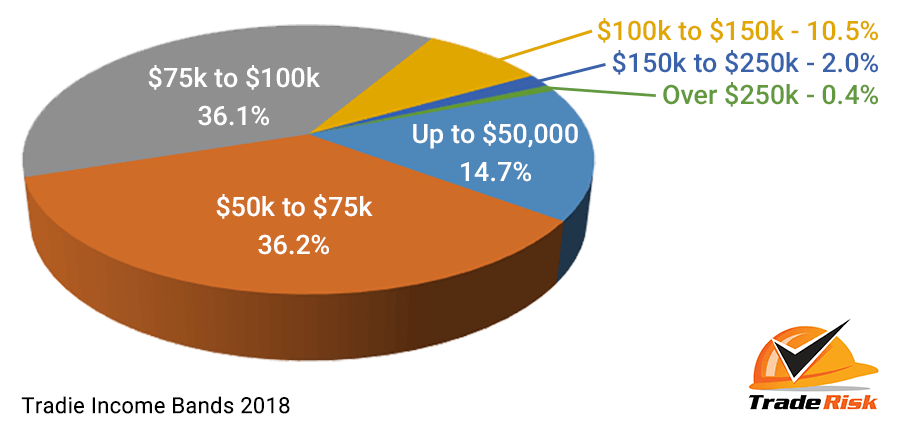
An interesting metric to look at each year is what percentage of tradies fit into the different income bands.
Unlike last year, in 2018 there wasn’t a huge amount of change in terms of the bands where most tradies income fell.
In the up to $50k range, the percentage dropped slightly from 15.9% to 14.7%. This is good news, meaning less tradies were in the lowest income band.
The $50k-$75k range grew from 34.8% to 36.2%. Presumably this increase was a direct result of the lower bands moving up.
The next band up, $75k-$100k, shrunk from 38.6% to 36.1%, but the good news is that some of these moved up, with the $100k-$150k range growing from 8.3% to 10.5%.
In more good news the $150k-$250k range also grew slightly, from 1.6% to 2.0%.
Looking at the highest income band of $250k+ the figure fell from 0.8% to 0.4%. That seems like a massive drop considering it has halved, but the number of data points we have for tradies with a taxable income of $250k+ is so low that the figures aren’t super reliable anyway.
So what’s the takeout here? There’s not much considering the relatively small changes across the board, but seeing more tradies move out of the sub-$50k range and into the $75k+ ranges is a big positive.
Observations
Each year there are various figures which grab our attention. Here we’ll look at some trends across the last four years of our reports.
Increasing stability
In last year’s report every trade in our top ten either moved up or down the list. No one stayed in their same position from the 2016 report, and some moved up to four or five spots either way.
This year however the list is far more stable. The top three have all remained the same, and the rest have only moved by a maximum of three places.
What’s the reason behind this? It could be that our report is becoming more mature, with more data to make the figures more reliable.
Electricians – the steady risers
Electricians are the only trade on our list that have increased each and every year for the history of our report.
And their rise has been incredibly consistent! In 2016 they rose by 4.1%, in 2017 4.3% and in 2018 3.2%. That steady and reliable growth sure makes electrical contracting an attractive option.
You can take a more in-depth look at our ‘how much do electricians earn‘ guide.
Boilermakes – the big movers
Boilermakers haven’t enjoyed increases every year of our report (having dropped 8.1% in 2016), but the last two years have seen massive increases.
In 2017 they jumped a huge 21.5% and in 2018 16.2%. The number of boilermakers we look after are much lower than the more common trades, so it could be that their figures are a little less reliable, but they are consistently towards the top of our list every year.
Conclusion
If you want to earn more than the national average, each of the top three trades on our list will get you there.
Although the other trades in the top ten have average incomes lower than the national average, it’s important to point out that plenty of those tradies are still doing very well for themselves.
For example although carpenters have an average income lower than the national average, our figures included plenty of chippies with incomes over $100k.
By the same token, the figures also included dozens of electricians and plumbers with income below the national average.
The takeaway here is that although some trades do have higher incomes on average, any tradie can earn a great income if they work hard enough and smart enough.
Want to see the previous reports? Follow the links to our 2017, 2016 and 2014 reports.
Important information about the figures
When looking at these figures it’s important to get some background on where they’ve come from.
The typical tradesman client of Trade Risk is a subcontractor or sole trader, often working on their own or with just a few staff.
Whilst there will be some clients running large teams and earning very strong six figure incomes, these are not the norm.
We also have clients who are semi-retired or just running their business on the side. To account for this we remove all figures where the declared income is less than $40,000. We’re assuming that anyone with an income below this figure is not running their business in a full-time capacity and shouldn’t be included in our figures.
It’s also important to note that the figures are based on personal income declared for income protection. So the figures are based on profit, not turnover.
Some tradies may say they ‘earn’ $100k, but if their business expenses are $25k a year then the figure we take is $75k.
We don’t claim that our figures are 100% accurate and reflect every tradesman across every industry.
But what we can say is that the figures have come from over 700 tradies from all states and territories, and based on previous years they are incredibly consistent and reliable across the years.
If you have any feedback on our report, please get in touch.
Author: Shane Moore. Last updated: 10/10/2018.
What to read next…
Starting an Electrical Business
Switching from Sole Trader to Company
What Insurance does a Contractor Need
Or perhaps something a little lighter…


